The following are some Jupyter Notebooks that kept me busy for some time.
More Notebooks will be created on this page. I will keep you posted!

Time Series Analysis
There is still room of improvement, of course, to improve accuracy.

Binary Classification Problem
The next project deals with a binary classification problem, where given a set of 13 features, the model needs to predict the binary outcome of the classifier. The dataset is publicly available for research purpose, and consists of records of customers with the following attributes:
| 1. job | 6. defaulted credit (yes/no) | 11. pdays (lapsed no. of days since last contact) |
| 2. age | 7. has housing loan? (yes/no) | 12. previous (no. of calls to customer prior to campaign) |
| 3. marital status | 8. has personal loan? (yes/no) | 13. poutcome (previous outcome of the campaign (yes/no)) |
| 4. education level | 9. contact type (cellular/fixed) | 14. y (label: yes/no) |
| 5. account balance | 10. campaign (no. of calls made to the customer during the campaign) |
Other redundant/irrelevant features were deleted to reduce complexity.
To produce a classifier friendly dataset, all categorical data need to be encoded into numerical data, i.e. [no,yes] to [0,1]. The dataset is checked for completeness, empty cells would need to be filled up. However, none empty cells or NAN cells were found. The relationships between the features were investigated. This dataset was found to have imbalanced distribution of class labels (4000 – negative, 521 – positive). Over-sampling and under-sampling methods were created to improve accuracy. However, it was found that the models gave higher accuracy with standard sampling, than with over- or under-sampling, so it appears that the models were capable to discern between the class 0 and 1 without the extra step. This can be confirmed by the higher weighted averaging scores (calculated based on the size of the classes) than the macro-averaging scores (calculated by giving equal weight to all predictions).
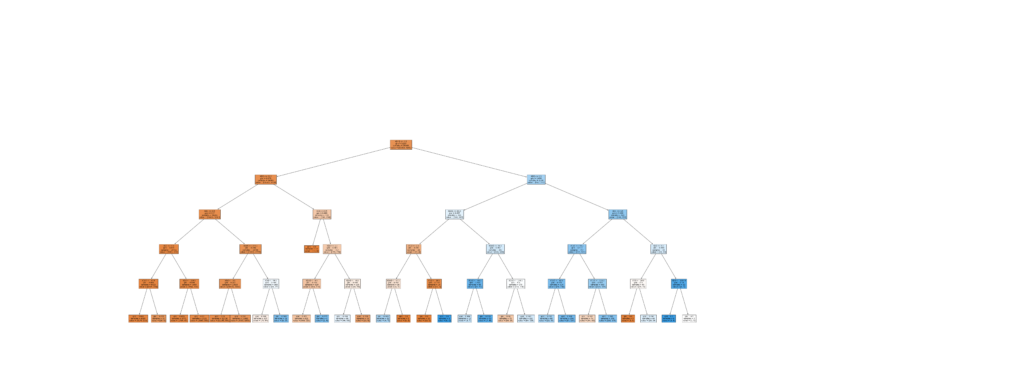
Models which use discriminant analysis, Naive Bayes, tree and ensemble of trees with boosting algorithms were compared and evaluated using scores such as minimum squared error while fitting, confusion matrix scores such as accuracy (TP + TN / total no. of samples), precision (TP/ (TP + FP) ), recall(TP/ (TP+ FN) ) and f1-score (2*precision*recall/(precision + recall)). The classification report at the end of each classifier model, gives also macro-averaging scores, i.e. the sum of scores divided over number of classes which is 2 in this case, and weighted averaging scores, i.e. sum of scores multiplied by number of samples in the given class divided over number of samples.
Based on the visualised results on confusion matrix, it is observed that the under sampling method results in overwhelmingly high number of TNs (True Negatives) and FNs (False Negatives) but very low TPs (True Positives) and FPs(False Positives). Too much information is removed which affected the performance of the models to detect ‘1’s/positives. Oversampling did not improve the accuracy, although the number of total predicted ‘1’s/positives did increase with highest TP accuracy at 41.9% with ADABoost Classifier. Using the standard sampling, it can be concluded that the Gradient Boosting Classifier is the best model to be used because it shows the strongest diagonal matrix among all other confusion matrices from other classifiers. The accuracies for TN and TP are 88.8% and 66.7%.